scgenome.pl.plot_cell_cn_matrix_fig#
- scgenome.pl.plot_cell_cn_matrix_fig(adata, layer_name='state', tree=None, cell_order_fields=None, annotation_fields=None, var_annotation_fields=None, fig=None, raw=False, vmin=None, vmax=None, cmap=None, max_cn=13, show_cell_ids=False, show_subsets=False)#
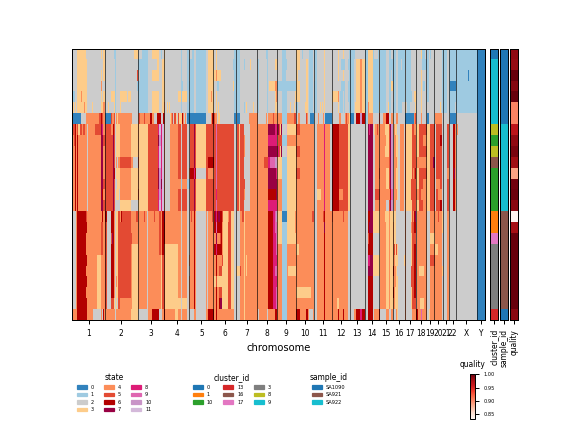
Plot a copy number matrix
- Parameters:
adata (AnnData) – copy number data
layer_name (str, optional) – layer with copy number data to plot, None for X, by default ‘state’
tree (Bio.Phylo.BaseTree.Tree, optional) – phylogenetic tree
cell_order_fields (list, optional) – columns of obs on which to sort cells, by default None
annotation_fields (list, optional) – column of obs to use as an annotation colorbar, by default ‘cluster_id’
fig (matplotlib.figure.Figure, optional) – existing figure to plot into, by default None
raw (bool, optional) – raw plotting, no integer color map, by default False
vmin (float, optional) – for raw=True, vmin and vmax define the data range that the colormap covers, see
matplotlib.pyplot.imshowvmax (float, optional) – for raw=True, vmin and vmax define the data range that the colormap covers, see
matplotlib.pyplot.imshowcmap (str, optional) – matplotlib colormap name, only used if raw=True
max_cn (int, optional) – clip cn at max value, by default 13
show_cell_ids (bool, optional) – show cell ids on heatmap axis, by default False
show_subsets (bool, optional) – show subset/superset categoricals to allow identification of cell sets
- Returns:
Dictionary of plot and data elements
- Return type:
Examples
import scgenome
adata = scgenome.datasets.OV2295_HMMCopy_reduced()

g = scgenome.pl.plot_cell_cn_matrix_fig(
    adata,
    cell_order_fields=['cell_order'],
    annotation_fields=['cluster_id', 'sample_id', 'quality'])